
Table of contents
Technical Analysis for Forex Beginners: The Complete Guide
Technical analysis is one of the most practical ways to approach forex trading because it helps you read price action, spot trends, and plan entries and exits with structure. If you are searching for technical analysis, forex technical analysis, technical analysis for beginners, or how to read forex charts, this guide will give you a clear starting point.
For new traders, technical analysis can feel overwhelming at first. The good news is that you do not need to learn every indicator or chart pattern to get started; you only need a simple framework, a few core tools, and a repeatable process.
What is Technical Analysis?
Technical analysis is the study of price movement on a chart to forecast possible future market behavior. Instead of focusing on company earnings or economic reports first, technical analysts study trends, support and resistance, candles, momentum, and chart patterns.
In forex, this matters because currencies move in reaction to supply and demand, market sentiment, and news expectations. A trader who understands how to analyze forex charts can make better decisions about when to enter, when to wait, and when to exit.
Why Beginners Should Start Here
Technical analysis is popular among forex traders because it is visual, structured, and flexible. It can be used for scalping, day trading, swing trading, and longer-term market analysis.
Here are the main reasons beginners should learn it early:
- It gives you a clear way to read the market.
- It helps you identify trend direction.
- It supports risk management with logical stop loss placement.
- It makes trade planning more disciplined.
- It works across multiple currency pairs and timeframes.
If you are looking for forex chart analysis for beginners or best technical analysis strategy for forex beginners, the goal is not perfection. The goal is consistency.
The core building blocks
Before diving into advanced methods, every beginner should understand these four foundations:
- Trend
A trend shows the general direction of price. It can be upward, downward, or sideways. - Support and resistance
Support is a zone where price may stop falling. Resistance is a zone where price may stop rising. - Candlestick patterns
Candles show how price moved during a specific time period and can reveal momentum or possible reversals. - Indicators
Tools such as moving averages, RSI, and MACD can help confirm direction and momentum.
These are the backbone of technical analysis forex trading and are far more useful than trying to chase every signal on the chart.
How to read a forex chart
A forex chart shows price movement over time. The three most common chart types are line charts, bar charts, and candlestick charts, but most traders prefer candlesticks because they give more detail.
Start by asking three simple questions:
- Is the market trending or ranging?
- Where are the major support and resistance levels?
- Is momentum strengthening or weakening?
This basic approach gives you a practical framework for how to read forex charts step by step. Once you understand these questions, you can begin to spot trade setups with much more confidence.
Popular indicators for beginners
You do not need dozens of indicators. In fact, too many tools can create confusion and slow decision-making.
A simple beginner-friendly mix includes:
- Moving averages to identify trend direction.
- RSI to measure overbought and oversold conditions.
- MACD to help spot momentum and possible shifts.
- Fibonacci retracement to identify potential pullback zones.
Used properly, these tools can support technical analysis for forex beginners without making the chart too complex. The key is to use indicators as confirmation, not as the only reason to trade.
Ready to Learn Technical Analysis the Right Way?
Most traders spend years jumping between strategies.
Instead, learn a complete trading framework inside the Technical Analysis Bootcamp.
🎓 Professional lessons
📈 Real chart examples
📚 Beginner-friendly
A simple beginner setup
A clean and practical setup might look like this:
- Use one higher timeframe to identify the trend.
- Use one lower timeframe to find the entry.
- Mark support and resistance first.
- Add one or two indicators only.
- Plan the stop loss before entering the trade.
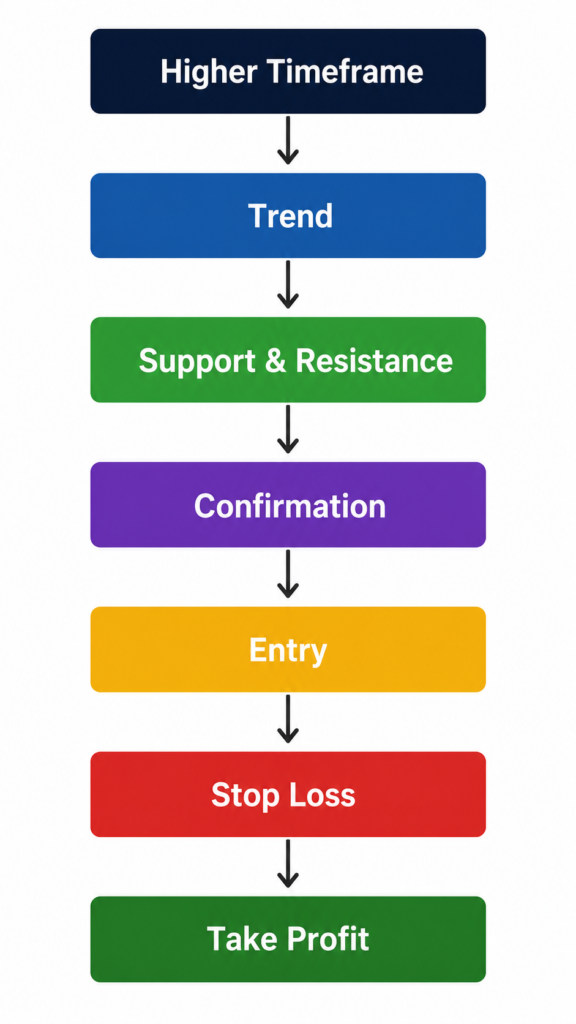
This is a much better approach than relying on random signals or overcrowded charts. If you want to improve faster, focus on simple forex technical analysis rather than trying to master everything at once.
Common Mistakes To Avoid
Beginners often make the same mistakes when learning technical analysis. Avoid these if you want to improve faster:
- Using too many indicators.
- Entering trades without a clear plan.
- Ignoring risk management.
- Chasing breakouts too late.
- Trading every signal instead of waiting for quality setups.
| Beginner Mistake | Better Approach |
|---|---|
| 10 Indicators | 2 Indicators |
| No Stop Loss | Defined Risk |
| Random Entries | Planned Entries |
| Emotional Trading | Trading Plan |
The strongest traders usually have a simpler process, not a more complicated one. That is why a disciplined method is so important for forex technical analysis strategy development.
How to improve faster
The fastest way to improve is to learn a repeatable process and practice it consistently. Review charts daily, note what worked, and study how price reacts around major levels.
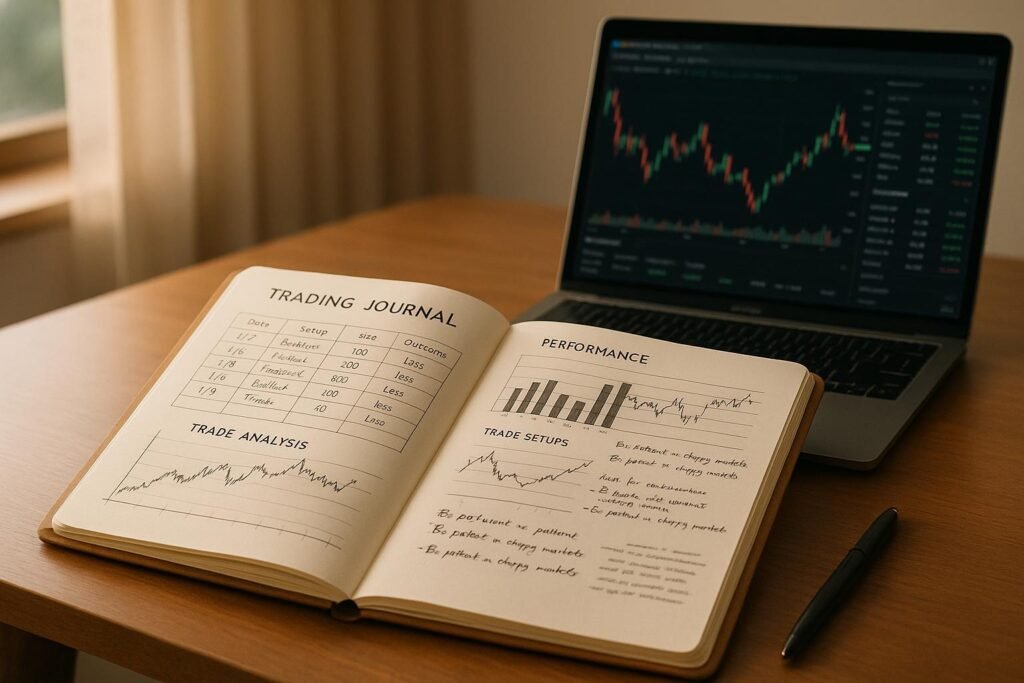
A good routine is:
- Mark the trend.
- Identify support and resistance.
- Check for confirmation signals.
- Define risk and reward.
- Review the result after the trade.
This habit builds skill over time and gives you a stronger foundation than memorizing patterns alone.
Learn from a structured training path
If you want a clearer and faster way to build your skills, consider joining the free webinar: The Ultimate Trading Formula at andreasthalassinos.com. It is a strong next step for traders who want to understand market structure, decision-making, and a more professional approach to trading.
You can also explore the Technical Analysis Bootcamp at andreasthalassinos.com if you want deeper, more structured learning. Both resources are useful if you are serious about building confidence and turning technical analysis into a practical trading skill.
Final thoughts
Technical analysis does not need to be complicated. If you learn trend, support and resistance, candlestick behavior, and a few key indicators, you already have enough to build a solid foundation.
The best way to become better is to keep your process simple, study charts regularly, and follow a structured learning path. Start with the basics, practice consistently, and move toward a rules-based approach that you can trust.
CTA: Register now for the free webinar The Ultimate Trading Formula and take the Technical Analysis Bootcamp at https://andreasthalassinos.com to build a stronger trading foundation today.