Reading a Forex chart is one of the most important skills any currency trader can develop.
Before you think about entering a trade, choosing an indicator, or calculating a position size, you need to understand what the chart is telling you.
A Forex chart shows the continuous battle between buyers and sellers. It reveals where price has been, how price is behaving now, and—most importantly for a trader—where potential opportunities and risks may be developing.11
The good news is that you do not need a chart filled with indicators to read Forex markets effectively.
You need a structured process.
In this guide, you will learn how to read Forex charts step by step, including how to understand currency pairs, candlesticks, timeframes, trends, support and resistance, market structure, price action, and potential entry and exit points.
You will also learn how to turn all of this information into a simple trading process that can be repeated across different Forex pairs and market conditions.
The objective is not to predict the market. The objective is to understand what price is doing, identify high-probability conditions, and manage risk when an opportunity appears.
Table of contents
- What Is a Forex Chart?
- Step 1: Understand the Currency Pair
- Step 2: Choose the Right Forex Chart Type
- Step 3: Learn How to Read a Candlestick
- Step 4: Choose the Correct Timeframe
- Step 5: Start With the Higher Timeframe
- Step 6: Identify the Trend
- Step 7: Learn to Identify Market Structure
- Step 8: Mark Support and Resistance
- Step 9: Look for Confluence
- Step 10: Read Price Action at Key Levels
- Step 11: Identify Your Entry Trigger
- Step 12: Place Your Stop Loss Where the Trade Is Invalidated
- Step 13: Calculate Your Position Size
- Step 14: Set Your Profit Target
- Step 15: Manage the Trade After Entry
- A Simple Forex Chart-Reading Process
- How to Read a Forex Chart Without Indicators
- Common Mistakes When Reading Forex Charts
- What Does a Good Forex Chart Look Like?
- A Practical Example of Reading a Forex Chart
- How to Practice Reading Forex Charts
- The Most Important Lesson: Read Price Before You Trade Price
- Forex Chart Reading Checklist
- Frequently Asked Questions About Reading Forex Charts
- How do beginners read Forex charts?
- Which Forex chart is best for beginners?
- What timeframe should I use for Forex trading?
- How do I identify a Forex trend?
- Do I need indicators to read Forex charts?
- How do I know when to enter a Forex trade?
- Where should I place my Forex stop loss?
- How much should I risk per Forex trade?
- Can beginners learn to read Forex charts?
- Final Thoughts
What Is a Forex Chart?
A Forex chart is a visual representation of how the exchange rate between two currencies changes over time.
Every Forex trade involves one currency being exchanged against another, which is why currencies are quoted in pairs.
For example:
- EUR/USD
- GBP/USD
- USD/JPY
- AUD/USD
- USD/CAD
If EUR/USD is trading at 1.1000, it means that one euro is currently worth approximately 1.1000 US dollars.
When you read a Forex chart, you are therefore studying the changing relationship between the two currencies in the pair.
The vertical axis represents price, while the horizontal axis represents time.
Your first job as a trader is not to find an entry.
Your first job is to understand the market environment.
Step 1: Understand the Currency Pair
Before analysing a Forex chart, understand what the pair represents.
A currency pair consists of two currencies:
Base currency / Quote currency
For EUR/USD:
- EUR is the base currency.
- USD is the quote currency.
If EUR/USD rises, the euro is strengthening relative to the US dollar—or the US dollar is weakening relative to the euro.
If EUR/USD falls, the euro is weakening relative to the US dollar—or the US dollar is strengthening relative to the euro.
This distinction matters because Forex traders are always analysing a relationship, not an isolated asset.
Major, Minor and Exotic Currency Pairs
Forex pairs are commonly divided into three broad categories.
Major pairs
These generally include the US dollar and some of the world’s most actively traded currencies.
Examples include:
- EUR/USD
- GBP/USD
- USD/JPY
- USD/CHF
- AUD/USD
- USD/CAD
- NZD/USD
Minor pairs
These involve major currencies but exclude the US dollar.
Examples include:
- EUR/GBP
- EUR/JPY
- GBP/JPY
- AUD/NZD
Exotic pairs
These generally combine a major currency with a currency from an emerging or smaller economy.
Exotic pairs can have wider spreads and different liquidity characteristics, so beginners should understand these differences before trading them.
Step 2: Choose the Right Forex Chart Type
There are several ways to display price.
The most common chart types are:
- Line charts
- Bar charts
- Candlestick charts
For most technical-analysis traders, candlestick charts provide the greatest amount of useful information at a glance.
A line chart generally connects closing prices.
A candlestick shows more information.
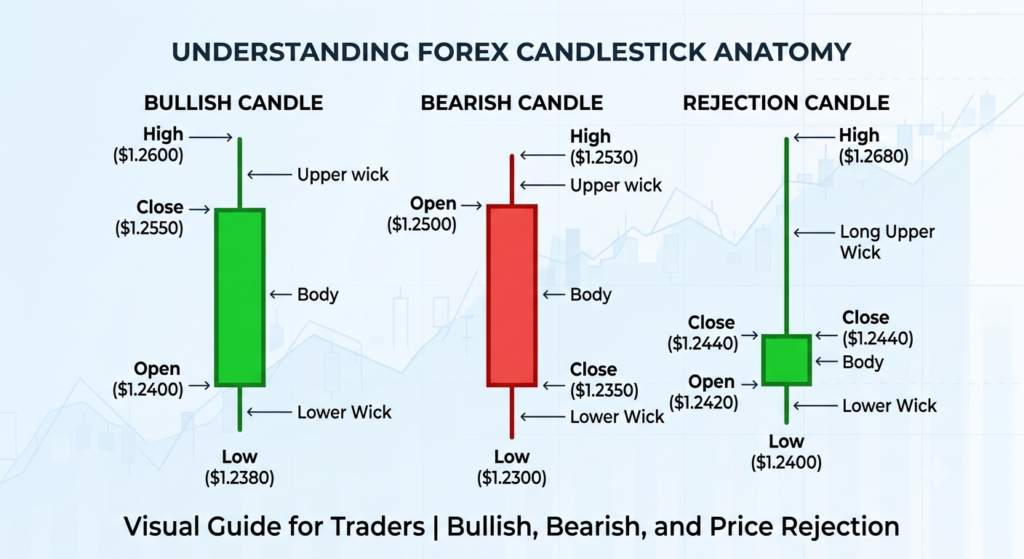
Each candle can show:
- Opening price
- Highest price
- Lowest price
- Closing price
This allows you to study not only where price finished but also what happened during the period.
That is extremely important when analysing price action.
Step 3: Learn How to Read a Candlestick
A candlestick consists of a body and, when present, upper and lower wicks.
The body represents the distance between the opening and closing prices.
The wicks show how far price travelled above or below the body during that period.
A bullish candle closes above its opening price.
A bearish candle closes below its opening price.
But experienced traders do not simply look at whether a candle is bullish or bearish.
They ask:
Where did the candle form?
That question changes everything.
A bullish candle in the middle of nowhere may mean very little.
A bullish rejection candle forming at important support can be much more significant.
This is why candlestick patterns should always be interpreted within their market context.
What Candlestick Wicks Tell You
Wicks can provide important information about rejected prices.
For example, imagine price falls toward a support level.
Sellers push the market below the level.
Then buyers enter and drive price back upward before the candle closes.
The result may be a candle with a long lower wick.
That wick tells us that lower prices were tested and rejected.
The candle does not guarantee that price will rise.
But it provides evidence about the interaction between buyers and sellers.
This is the foundation of price-action analysis.
Step 4: Choose the Correct Timeframe
One of the biggest mistakes beginners make is analysing only one timeframe.
A Forex chart can look completely different depending on the timeframe selected.
For example:
- A 5-minute chart may show a short-term downtrend.
- A 1-hour chart may show a sideways market.
- A 4-hour chart may show a strong uptrend.
- A daily chart may show a broader consolidation.
Which one is correct?
They all are.
They are simply showing different levels of market structure.
The solution is not to find the “perfect” timeframe.
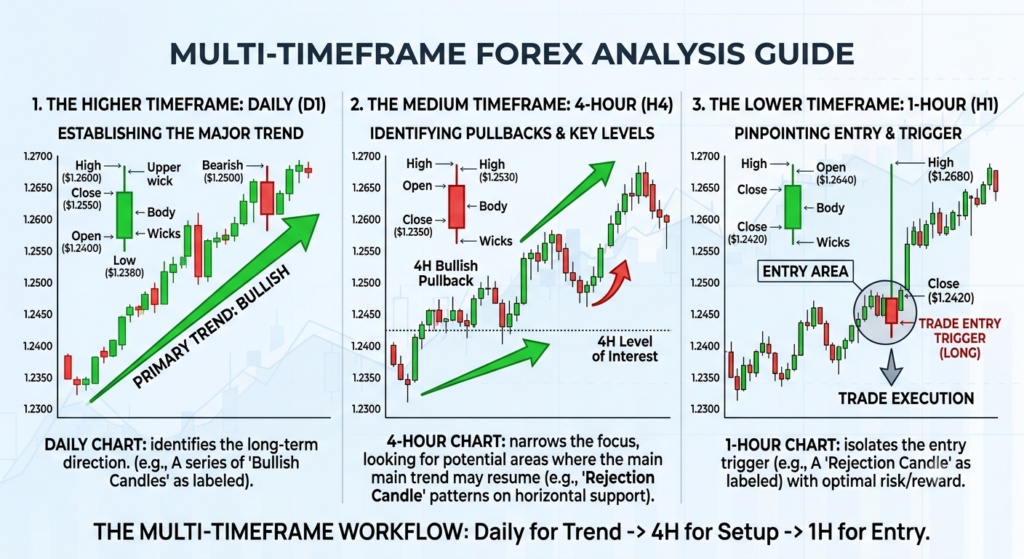
The solution is to use a multi-timeframe approach.
Step 5: Start With the Higher Timeframe
Before looking for an entry, step back.
Start with a higher timeframe to establish the broader market structure.
For a swing trader, this could mean beginning with:
- Daily
- 4-hour
Then moving down to:
- 4-hour
- 1-hour
for more precise analysis and execution.
The exact combination depends on your trading style.
The principle remains the same:
Higher timeframe first. Lower timeframe second.
The higher timeframe provides context.
The lower timeframe provides precision.
Step 6: Identify the Trend
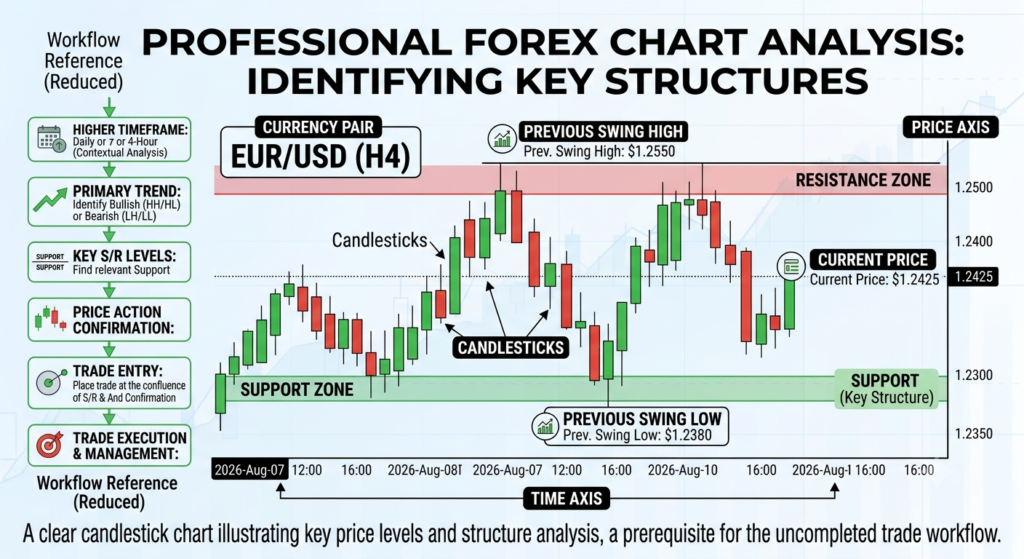
Once you have established the broader timeframe, determine whether the market is:
- Trending higher
- Trending lower
- Moving sideways
This is one of the most important decisions in technical analysis.
Uptrend
An uptrend generally develops through:
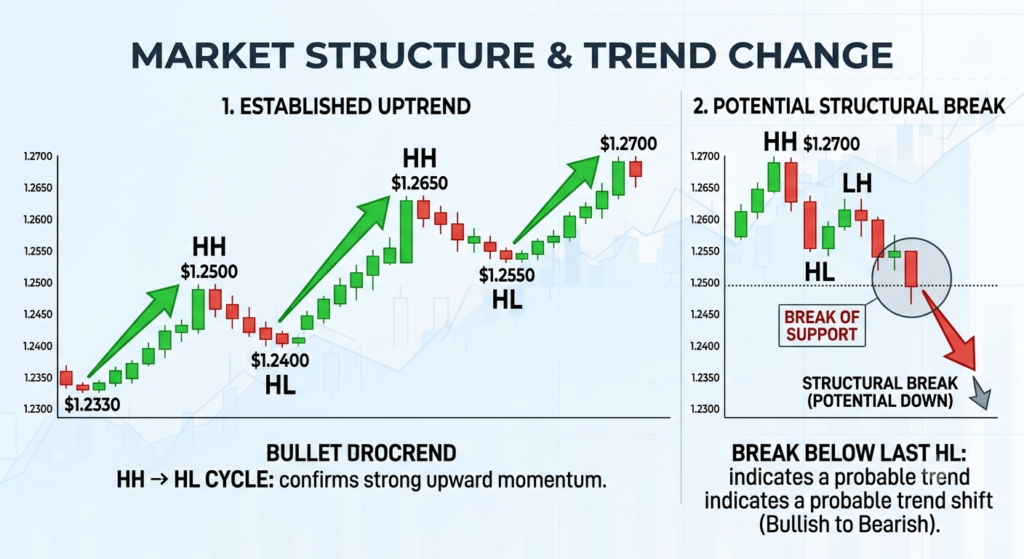
Higher Highs + Higher Lows
Price continues to create new swing highs while maintaining progressively higher swing lows.
Downtrend
A downtrend generally develops through:
Lower Highs + Lower Lows
Price creates lower swing highs and lower swing lows.
Range
A ranging market moves between relatively defined areas of support and resistance without establishing a sustained directional trend.
The mistake many traders make is trying to trade every market condition using the same strategy.
A trend-following setup may perform well in a trending market but poorly inside a narrow range.
The market environment must therefore come before the strategy.
Step 7: Learn to Identify Market Structure
Market structure is the framework created by significant swing highs and swing lows.
It helps answer a critical question:
Who is currently in control—buyers or sellers?
Consider an uptrend.
If buyers repeatedly defend higher lows and price continues to break previous highs, the structure suggests that buyers remain in control.
But if price suddenly breaks below an important higher low, the structure may be changing.
This does not automatically mean that a new downtrend has begun.
It means the existing structure has been damaged and requires further analysis.
This distinction is important.
A break in structure is information—not an automatic trading signal.
Step 8: Mark Support and Resistance
After identifying the trend, look for important areas where price has previously reacted.
These are commonly referred to as support and resistance.
Support
Support is an area where buying pressure has previously emerged strongly enough to halt or slow a decline.
Resistance
Resistance is an area where selling pressure has previously emerged strongly enough to halt or slow an advance.
Do not think of support and resistance as perfect mathematical lines.
Markets are rarely that precise.
It is often more useful to think in terms of zones.
A support zone may extend across a range of prices rather than existing at one exact number.
The same applies to resistance.
Step 9: Look for Confluence
A single technical factor rarely provides enough information on its own.
Instead, look for confluence.
Confluence occurs when several independent technical factors support the same trading idea.
For example:
- Higher-timeframe uptrend
- Price approaching support
- Support aligns with a previous swing low
- Fibonacci retracement reaches the same area
- Bullish rejection candle appears
Each factor adds context.
The objective is not to collect as many signals as possible.
The objective is to identify situations where different pieces of evidence point toward the same conclusion.
Step 10: Read Price Action at Key Levels
Now comes one of the most important parts of reading a Forex chart.
Watch what price does when it reaches an important area.
Suppose EUR/USD is approaching established support.
Do not automatically buy simply because price has reached the level.
Wait.
Observe.
Does price reject the level?
Does a bullish engulfing candle appear?
Does a hammer form?
Does price break above the high of the confirmation candle?
The market must show you evidence that buyers are responding.
This is the difference between anticipating and confirming.
Anticipation says:
“Price has reached support, so I will buy.”
Confirmation says:
“Price has reached support, sellers attempted to push lower, buyers rejected those prices, and price has now confirmed the rejection.”
The second approach provides a more structured basis for the decision.
Step 11: Identify Your Entry Trigger
Once the market context is established, define exactly what will trigger your entry.
For example, a bullish setup might require:
- Higher-timeframe uptrend
- Price retraces toward support
- Price forms a bullish rejection candle
- The candle closes above the support zone
- Price breaks the confirmation candle’s high
Only then does the trade become valid.
The exact rules will depend on your strategy.
What matters is that they are defined before the trade.
Step 12: Place Your Stop Loss Where the Trade Is Invalidated
Your stop loss should not be based simply on how much money you feel comfortable losing.
It should be based on market structure.
Ask:
At what price would my trading idea no longer make sense?
For a bullish setup, the stop might sit:
- Below a swing low
- Below support
- Beyond the rejection candle
- Beyond a volatility buffer such as ATR
The precise placement depends on the strategy and market conditions.
The key principle is simple:
Your stop should invalidate the trade thesis.
Then position size should be adjusted to fit your risk limit.
Not the other way around.
Step 13: Calculate Your Position Size
Risk management is an essential part of reading and trading Forex charts.
Suppose your account is £10,000 and you decide to risk 1% on a trade.
Your maximum planned loss is:
£10,000 × 1% = £100
If your stop loss is relatively wide, your position size should be smaller.
If your stop is tighter, the position size can be larger—provided the calculated monetary risk remains within your predefined limit.
This is one of the fundamental principles of professional risk management:
The stop determines the position size.
Never increase your position simply because you want to make more money from the trade.
Step 14: Set Your Profit Target
Before entering the trade, determine where you will take profits.
Potential target areas include:
- Previous swing high
- Previous swing low
- Resistance
- Support
- Measured moves
- Fibonacci extensions
- A predefined risk-to-reward objective
For example, if your initial risk is 50 pips and your target is 100 pips, the planned risk-to-reward ratio is 1:2.
But do not choose a target simply because you want a particular ratio.
The target should make sense within the structure of the market.
A 1:3 target that sits directly inside major resistance may be less realistic than a 1:1.5 target placed at a logical structural level.
Context comes first.
Step 15: Manage the Trade After Entry
Reading a Forex chart does not stop when you enter a position.
You must continue to monitor the information coming from price.
Your trading plan should specify:
- When to move the stop
- When to take partial profits
- Whether to trail the stop
- What constitutes a failed setup
- When to exit because momentum has disappeared
Do not improvise these rules after the trade has been opened.
That is when emotions become strongest.
A Simple Forex Chart-Reading Process
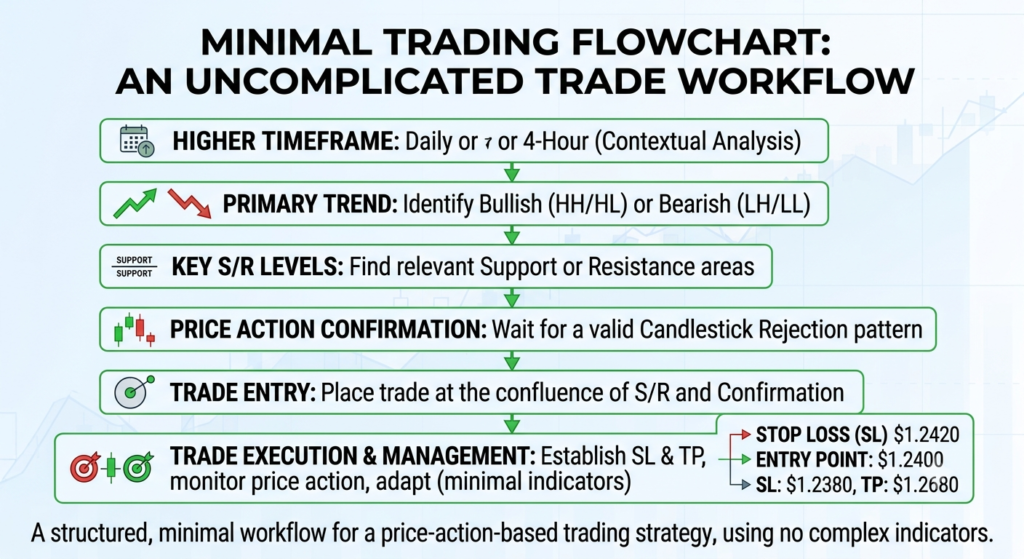
If you want to simplify everything you’ve learned, use this sequence:
1. Higher Timeframe
Establish the broader market context.
2. Trend
Determine whether the market is bullish, bearish, or ranging.
3. Market Structure
Identify significant swing highs and lows.
4. Support & Resistance
Mark important price zones.
5. Confirmation
Wait for price action to confirm the trading idea.
6. Entry
Execute according to predefined rules.
7. Stop Loss
Place the stop where the trade thesis is invalidated.
8. Take Profit
Target the next logical area of price.
9. Trade Management
Manage the position according to your plan.
This process prevents one of the most common mistakes in Forex trading: starting with the entry.
Professional analysis starts with context.
How to Read a Forex Chart Without Indicators
You can learn a great deal from a Forex chart without using multiple indicators.
Start with:
- Trend
- Swing highs
- Swing lows
- Support
- Resistance
- Candlestick behaviour
- Breakouts
- Rejections
- Market structure
Indicators can be useful as confirmation tools.
For example, a moving average may help visualise trend direction, while ATR may assist with volatility and stop placement.
But indicators should not replace price analysis.
A chart filled with indicators can create the illusion of certainty.
It cannot eliminate uncertainty.
The market will always involve probabilities.
Your job is to build a process that manages those probabilities and protects your capital when the market does not behave as expected.
Common Mistakes When Reading Forex Charts
Mistake 1: Looking for an Entry Too Early
Beginners often open a chart and immediately ask:
“Where should I buy?”
The better question is:
“What is the market doing?”
Context comes before execution.
Mistake 2: Trading Against the Higher-Timeframe Trend
A short-term reversal may look attractive on a lower timeframe while the broader market remains strongly directional.
Always understand the larger structure before committing capital.
Mistake 3: Treating Every Candlestick Pattern as a Signal
A hammer is not automatically bullish.
A bearish engulfing candle is not automatically a short signal.
Location matters.
A candlestick pattern at an important structural level is more meaningful than the same pattern appearing randomly in the middle of a range.
Mistake 4: Drawing Too Many Levels
If your chart contains twenty support and resistance lines, none of them is likely to receive the attention it deserves.
Focus on the levels that matter.
Mistake 5: Moving Your Stop Loss
Moving a stop further away simply because price is approaching it changes the original risk of the trade.
If the market invalidates your setup, accept the loss.
Capital preservation is more important than being right.
Mistake 6: Overtrading
A Forex market is open for much of the week, but that does not mean you should trade constantly.
Professional trading is selective.
Sometimes the best trade is no trade.
What Does a Good Forex Chart Look Like?
A good trading chart does not need to look complicated.
It should allow you to answer five questions quickly:
1. What is the trend?
2. Where are the important structural levels?
3. Where is price currently located?
4. What would confirm my trade idea?
5. Where is my trade invalidated?
If you cannot answer those questions, you probably do not have enough information to trade.
Image Suggestion 6: Clean vs Cluttered Forex Chart
Suggested visual: Side-by-side comparison.
Left: A chart overloaded with indicators.
Right: A clean price-action chart showing trend, support, resistance, entry, stop and target.
Alt text: “Comparison of a cluttered Forex chart and a clean price-action trading chart.”
A Practical Example of Reading a Forex Chart
Imagine GBP/USD is trading within a broader uptrend.
The daily chart shows higher highs and higher lows.
You move to the 4-hour chart and notice that price has pulled back toward a previous support area.
Instead of buying immediately, you wait.
Price briefly moves below the support zone but then closes back above it, creating a bullish rejection candle.
Now you have several pieces of information:
- Higher-timeframe trend is bullish.
- Price has retraced into an important area.
- Previous support is being tested.
- Sellers attempted to push price lower.
- Buyers rejected those lower prices.
- A bullish confirmation candle has formed.
You can now define the trade.
The entry could be triggered above the confirmation candle.
The stop could be placed below the relevant swing low.
The target could be the previous swing high or another predefined structural objective.
Notice what happened.
The trade did not begin with a prediction.
It began with context, structure, location and confirmation.
That is how a professional trading process should work.
How to Practice Reading Forex Charts
The ability to read charts is developed through repetition.
Do not simply stare at live charts for hours.
Use historical data.
Choose one currency pair.
Open a historical chart and hide the future price action.
Then move forward candle by candle.
At each point, ask:
- What is the trend?
- What is the market structure?
- Where are support and resistance?
- Is price approaching an important level?
- What would confirm a trade?
- Where would the stop go?
- Where would the target go?
- Would I take this trade according to my rules?
Record the answer.
Then reveal what happened next.
This process trains you to read the market without the benefit of hindsight.
The Most Important Lesson: Read Price Before You Trade Price
Learning how to read Forex charts is not about memorising dozens of candlestick formations or adding more indicators.
It is about learning to interpret the relationship between price, time, structure and market psychology.
Start from the higher timeframe.
Identify the trend.
Study market structure.
Mark meaningful support and resistance.
Wait for price to reach an area where a trade makes sense.
Then wait for confirmation.
Only after that should you consider the entry.
And before you enter, know exactly where you will exit if you are wrong.
That sequence creates discipline.
The market does not owe us a trade.
Our responsibility is not to predict every movement.
Our responsibility is to recognise the right conditions, manage risk intelligently, and execute our plan consistently.
Forex Chart Reading Checklist
Before entering a trade, ask yourself:
Market Context
☐ What is the higher-timeframe trend?
☐ Is the market trending or ranging?
Market Structure
☐ What are the latest swing highs?
☐ What are the latest swing lows?
☐ Has the existing structure been maintained or broken?
Key Levels
☐ Where are the major support zones?
☐ Where are the major resistance zones?
Price Action
☐ Has price reached a meaningful level?
☐ Is there a valid confirmation pattern?
☐ Does the price action support the trade direction?
Risk Management
☐ Where is the trade invalidated?
☐ What is the stop-loss distance?
☐ What position size is appropriate?
☐ Does the potential reward justify the risk?
Trade Management
☐ Where is the first target?
☐ What will I do if price stalls?
☐ When will I move or trail the stop?
If you cannot answer these questions clearly, there is no need to force the trade.
Wait.
The market will always provide another opportunity.
Frequently Asked Questions About Reading Forex Charts
How do beginners read Forex charts?
Beginners should start by learning how to identify the currency pair, timeframe, candlesticks, trend, market structure, support and resistance. Once those foundations are understood, they can learn to identify price-action confirmations and build a structured entry and exit process.
Which Forex chart is best for beginners?
Candlestick charts are generally a practical starting point because each candle displays the open, high, low and close. Beginners should also learn to compare multiple timeframes rather than relying on one chart alone.
What timeframe should I use for Forex trading?
There is no universally best timeframe. The appropriate timeframe depends on your trading style. Swing traders commonly focus on higher timeframes such as the daily and 4-hour charts, while shorter-term traders may use lower timeframes.
How do I identify a Forex trend?
An uptrend generally consists of higher highs and higher lows, while a downtrend generally consists of lower highs and lower lows. A market that repeatedly moves between established support and resistance may be ranging.
Do I need indicators to read Forex charts?
No. You can learn to read Forex charts using price action, market structure, support and resistance, and candlestick behaviour. Indicators can be useful as confirmation tools, but they should not replace an understanding of price.
How do I know when to enter a Forex trade?
An entry should be based on predefined conditions. A common approach is to wait for price to reach an important structural level and then look for confirmation that buyers or sellers are actually responding before entering.
Where should I place my Forex stop loss?
A stop loss should generally be placed where the trade idea becomes invalid, such as beyond a relevant swing high, swing low, support or resistance level. Position size should then be adjusted according to the distance between entry and stop.
How much should I risk per Forex trade?
There is no universal percentage suitable for every trader, but a conservative rules-based approach is to limit the amount of capital exposed to any individual trade and maintain consistent risk across trades. The appropriate level should reflect your strategy, account size and overall risk tolerance.
Can beginners learn to read Forex charts?
Yes. Chart reading is a skill that can be developed through structured study and deliberate practice. Beginners should focus on a small number of concepts and learn to apply them consistently rather than trying to master every technical indicator or pattern at once.
Final Thoughts
Learning how to read Forex charts is one of the foundations of technical analysis.
But reading a chart is not the same as predicting the market.
A professional trader looks at a chart and asks:
What is price doing?
Where is price in relation to market structure?
Where are the important levels?
What would confirm the setup?
Where am I wrong?
How much am I prepared to risk?
Those questions create a framework for making decisions.
The goal is not to become a trader who can identify hundreds of patterns.
The goal is to become a trader who can recognise a small number of high-quality situations and execute them with discipline.
Start with the higher timeframe.
Identify the trend.
Understand the structure.
Mark support and resistance.
Wait for confirmation.
Define your entry, stop loss and target.
Then manage your risk.
Keep your charts clean. Keep your rules clear. And remember: price leads, indicators follow.
That is the foundation of professional Forex chart reading.